Next.js with Prometheus
Next.js is a popular React framework that allows for server-side rendering and static site generation. It is used to build production-grade web applications with ease. Prometheus, on the other hand, is an open-source monitoring system that collects metrics from various sources and stores them in a time-series database.
Using Prometheus with Next.js can provide valuable insights into the performance and health of your web application. Here are some benefits of integrating Prometheus with Next.js:
- Real-time monitoring: Prometheus provides real-time metrics that can help you identify issues with your Next.js application. For example, you can monitor the response time of your server and detect when it's taking longer than usual to respond to requests.
- Customizable dashboards: Prometheus allows you to create custom dashboards that display the metrics you care about the most. You can create graphs and charts that show the performance of your Next.js application over time.
- Alerting: Prometheus can send alerts when certain metrics exceed a defined threshold. This can help you quickly identify and address issues before they become major problems.
To integrate Prometheus with Next.js, you can use the prom-client library. This library provides an easy-to-use API that allows you to instrument your code and collect metrics.
But unfortunately, there is no way to track all HTTP requests without using the Custom Server feature of Next.js. In this article I will use fastify with fastify-metrics library for that.
Tools
There list of tools that we will use in this article:
Setup
First, we need to create a new Next.js project. We can do this by running the following command:
1npx create-next-app@latestI will use App Router and TypeScript for this project. So, I will select them in the setup wizard.
1✔ What is your project named? … next-prometheus-example
2✔ Would you like to use TypeScript? … Yes
3✔ Would you like to use ESLint? … Yes
4✔ Would you like to use Tailwind CSS? … Yes
5✔ Would you like to use `src/` directory? … Yes
6✔ Would you like to use App Router? (recommended) … No
7✔ Would you like to customize the default import alias? … No
After the setup is complete, we can start the development server by running the following command:
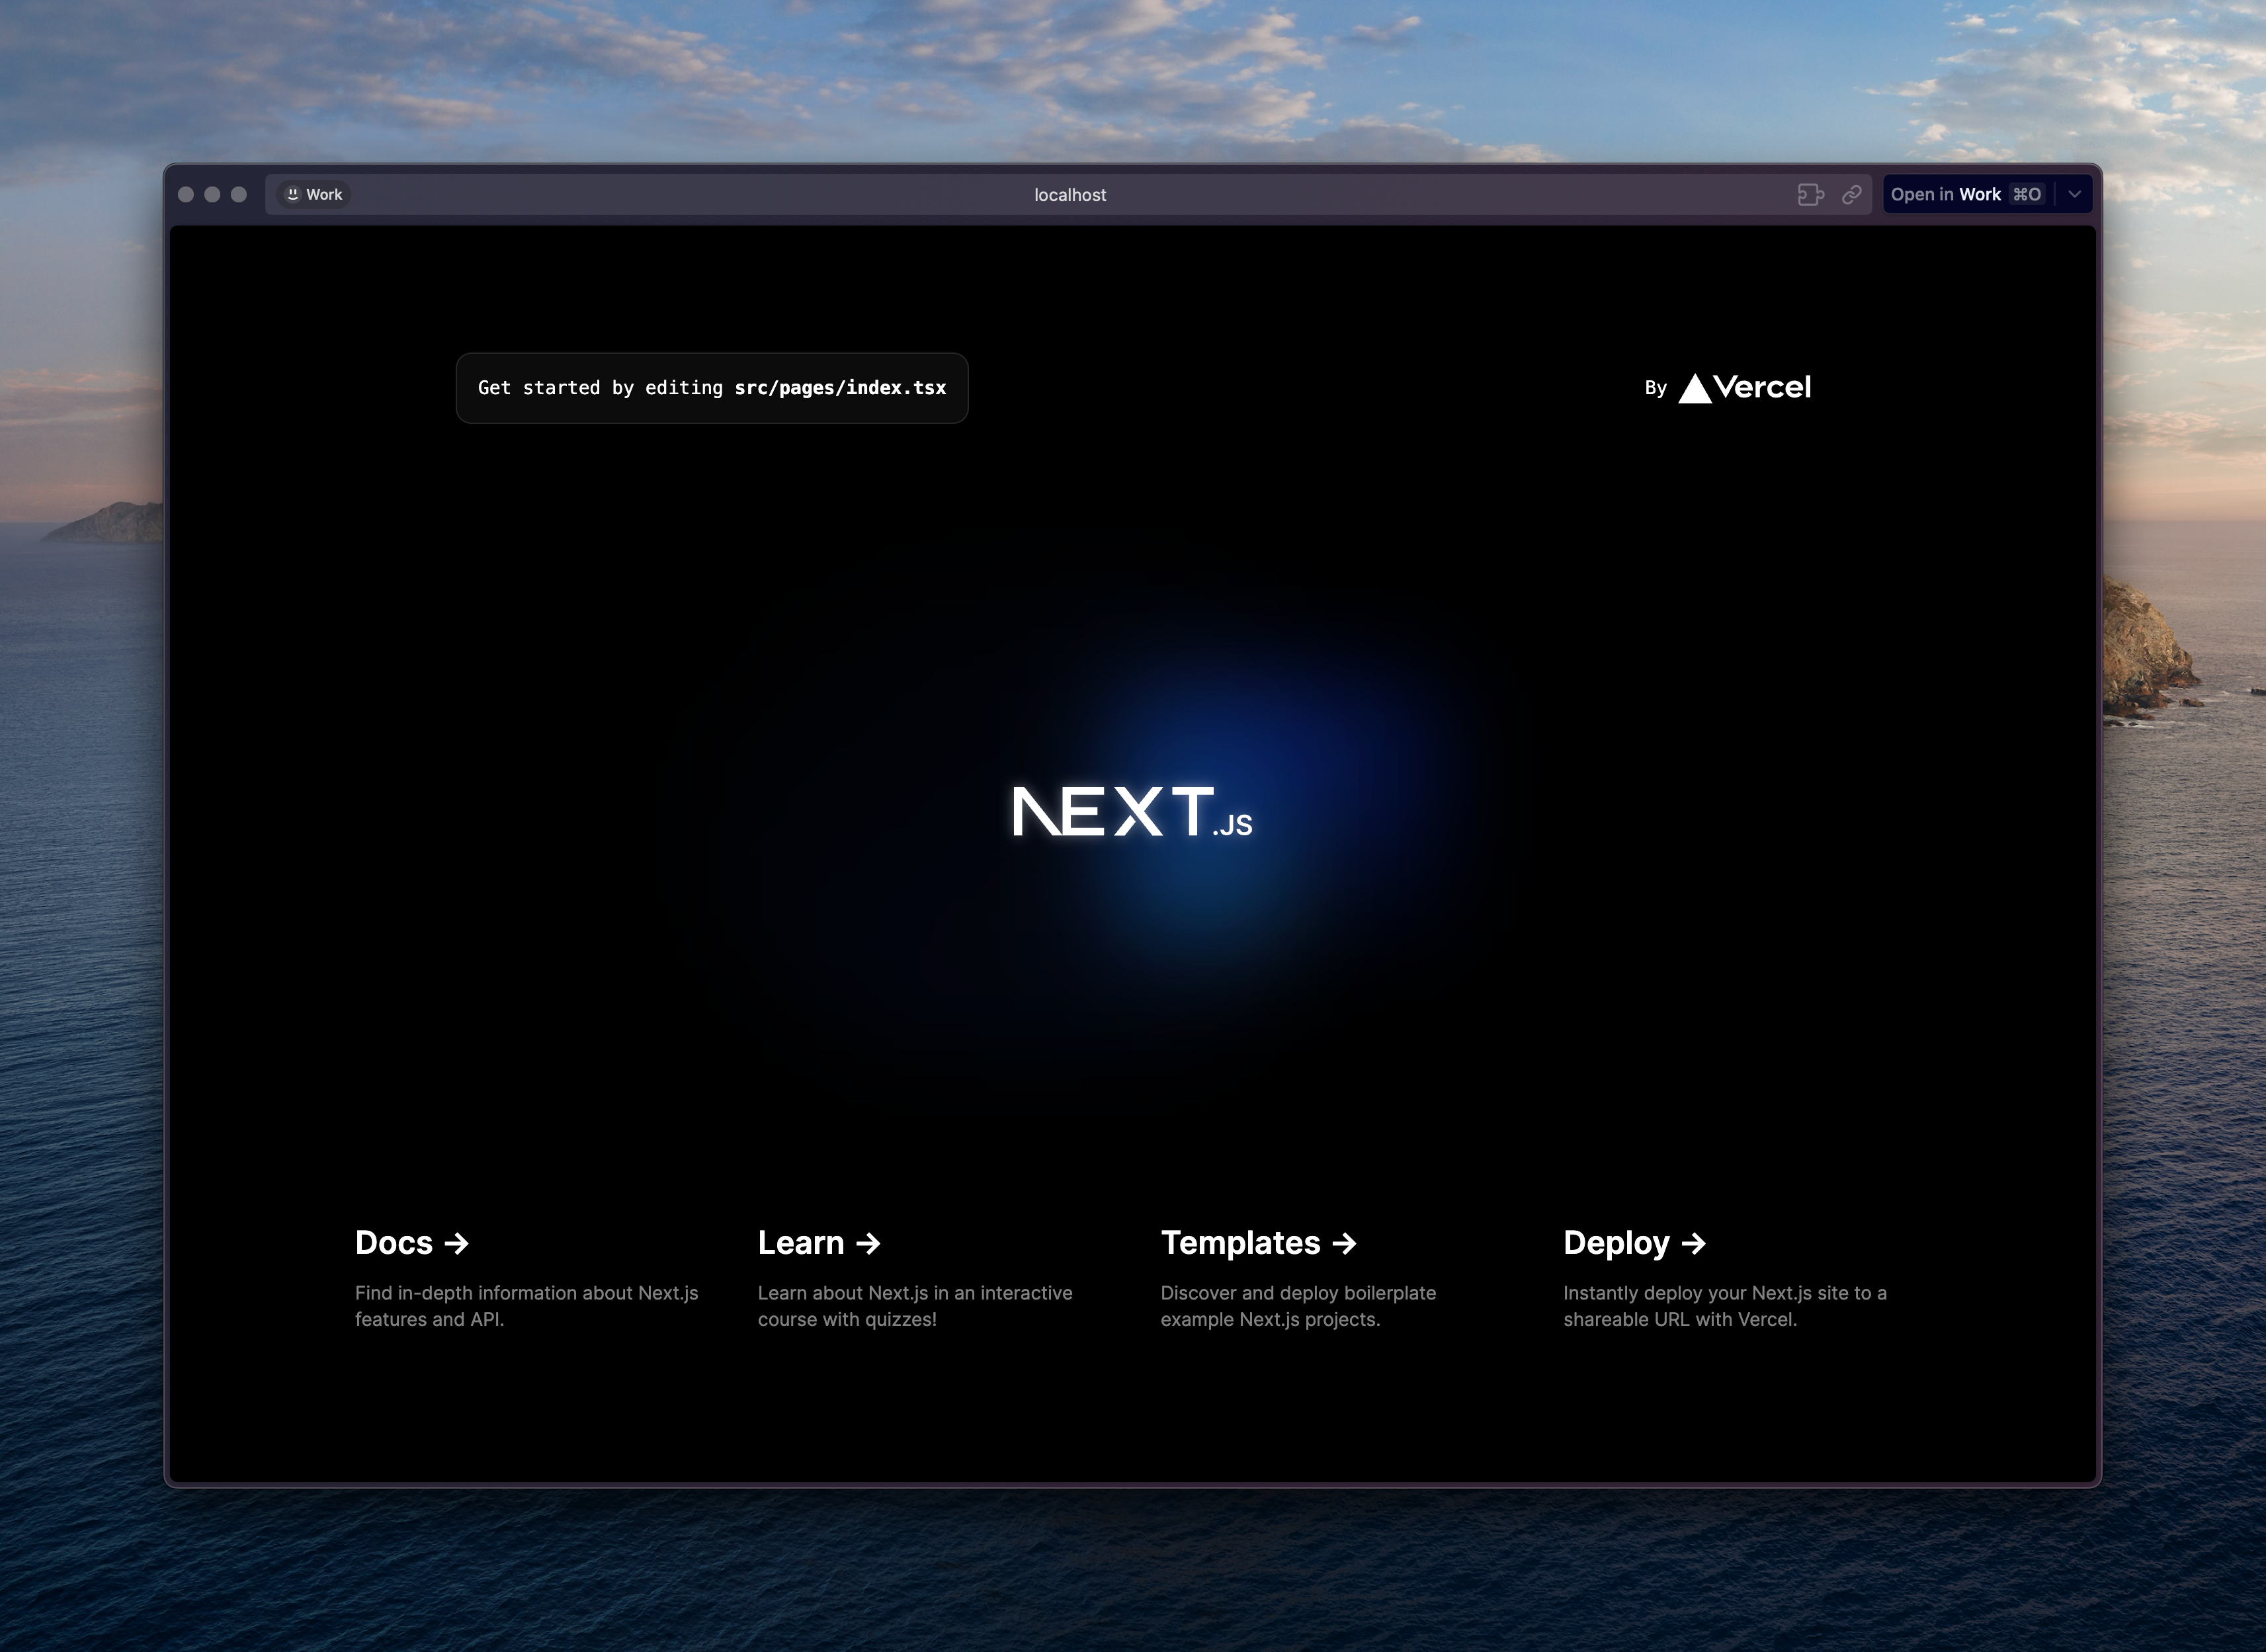
1npm run devNow, we can open the application in our browser and see the default Next.js page.

Setup custom server with Fastify
Next.js allows us to create a custom server using the server.js file. We can use this file to configure our server and add custom routes. In this article, we will use Fastify as our server framework. Unfortunatelly Next.js doesn't support Typescript for custom server, but with some hacks we can make it work. If you want to use plain JavaScript, you can skip this step.
Setup TypeScript for custom server
First, let's install the required dependencies:
1npm install --save-dev nodemon ts-nodeNext let's create server folder with server.ts file inside it. We do it to separate our server code from the rest of the application, but it's not required.
1mkdir server
2touch server/server.ts
Next, we need to create a nodemon.json file in the root directory of our project. This file will be used by nodemon to run our server.
1{
2  "watch": ["server/**/*.ts"],
3  "exec": "ts-node --project tsconfig.server.json ./server/server.ts",
4  "ext": "js ts"
5}
Next, we need to create a tsconfig.server.json file in the root directory of our project. This file will be used by ts-node to compile our server code.
1{
2  "extends": "./tsconfig.json",
3  "compilerOptions": {
4    "module": "commonjs",
5    "outDir": "dist",
6    "lib": ["es2019"],
7    "target": "es2019",
8    "isolatedModules": false,
9    "noEmit": false
10  },
11  "include": ["server/**/*.ts"]
12}
As last step there is a need to update package.json file to add new scripts:
1{
2  "scripts": {
3    "dev": "TS_NODE_PROJECT=tsconfig.server.json nodemon --exec node --inspect -r ts-node/register ./server/server.ts",
4    "build": "npm run build:server && npm run build:next",
5    "build:next": "next build",
6    "build:server": "tsc --project tsconfig.server.json",
7    "start": "node dist/server/server.js",
8    "lint": "next lint"
9  }
10}
At the end of this step our project will not be able to start, because we don't have server.ts file yet. Let's create it.
Setup Fastify
First, we need to install the required dependencies:
1npm install --save fastifyNext, we need to create a server.ts file in the server folder. This file will be used to configure our server and add custom routes.
1import fastify from 'fastify';
2import next from 'next';
3import { parse } from 'url';
4
5const port = parseInt(process.env.PORT || '3000', 10);
6const isDev = process.env.NODE_ENV !== 'production';
7const app = next({ dev: isDev, hostname: 'localhost', port });
8const handle = app.getRequestHandler();
9const server = fastify({
10  logger: {
11    level: isDev ? 'debug' : 'info'
12  }
13});
14
15app.prepare().then(async () => {
16  server.all('*', async (request, response) => {
17    return handle(request.raw, response.raw, parse(request.url, true));
18  });
19  server
20    .listen({
21      port,
22      host: '0.0.0.0'
23    })
24    .then(() => {
25      console.log('server started');
26    });
27});
Now, we can start the development server by running the following command:
1npm run devAfter the server is started, we can open http://localhost:3000 in our browser and see the default Next.js page.
Setup Fastify Metrics
First, we need to install the required dependencies:
1npm install --save fastify-metricsNext, we need to update server.ts file in the server folder. This file will be used to configure our server and add custom routes.
1import fastify, { FastifyRequest } from 'fastify';
2import next from 'next';
3import { parse } from 'url';
4import metricsPlugin from 'fastify-metrics';
5
6const port = parseInt(process.env.PORT || '3000', 10);
7const isDev = process.env.NODE_ENV !== 'production';
8const app = next({ dev: isDev, hostname: 'localhost', port });
9const handle = app.getRequestHandler();
10const server = fastify({
11  logger: {
12    level: isDev ? 'debug' : 'info'
13  }
14});
15
16app.prepare().then(async () => {
17  // Setup prometheus metrics plugin
18  await server.register(metricsPlugin, {
19    endpoint: '/api/metrics',
20    defaultMetrics: {
21      enabled: true,
22      labels: {
23        name: 'next-prometheus-example',
24        version: '0.1.0'
25      }
26    },
27    routeMetrics: {
28      groupStatusCodes: true,
29      routeBlacklist: ['/api/metrics'],
30      customLabels: {
31        name: 'next-prometheus-example',
32        version: '0.1.0'
33      },
34      overrides: {
35        labels: {
36          // This is a custom label for the route name. It will try to use pathname or urls if not provided.
37          getRouteLabel: (request: FastifyRequest) => {
38            if (request.routeConfig.statsId) {
39              return request.routeConfig.statsId;
40            }
41            const parsedUrl = parse(request.url, true);
42            return parsedUrl.pathname ?? request.url;
43          }
44        }
45      }
46    }
47  });
48
49  server.all('*', async (request, response) => {
50    return handle(request.raw, response.raw, parse(request.url, true));
51  });
52  server
53    .listen({
54      port,
55      host: '0.0.0.0'
56    })
57    .then(() => {
58      console.log('server started');
59    });
60});
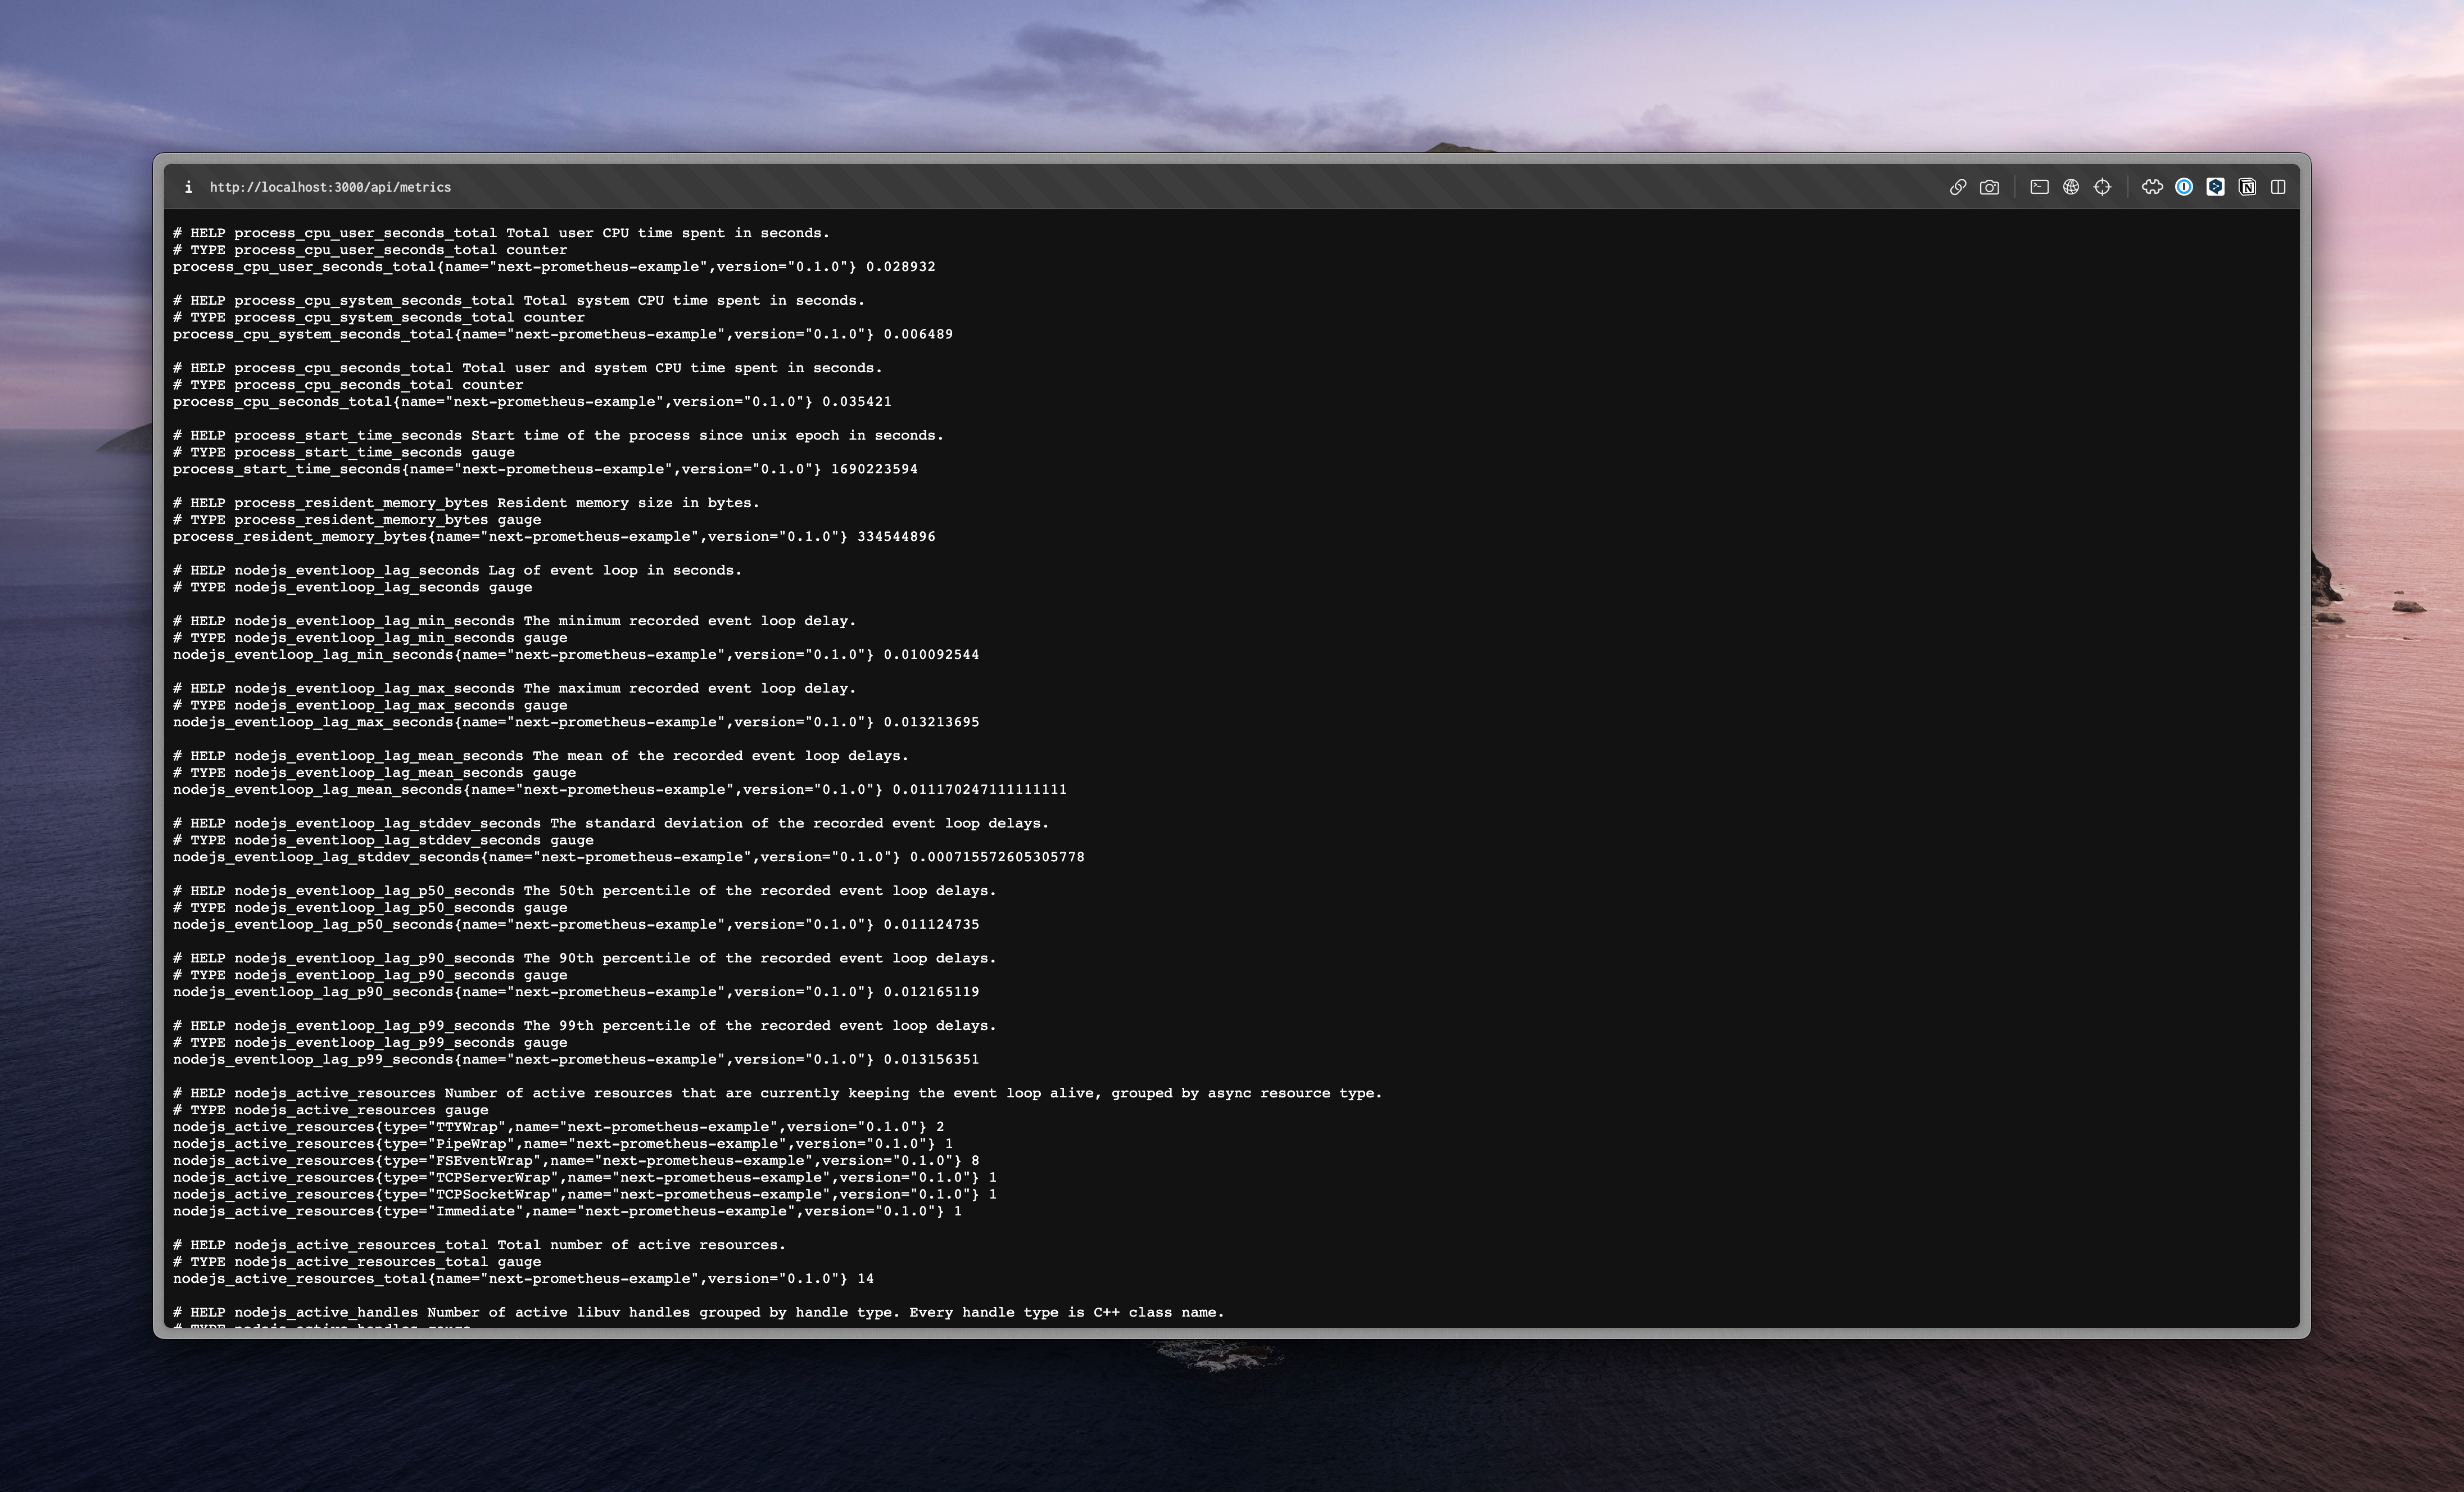
Now, we can start the development server and check the metrics endpoint /api/metrics. Result should be similar to this:

Some customizations that can be useful
- Use
pino-prettyto format logs in development mode - You can customize what will be in
routelabel by usingstatsIdproperty in request. For example, it can be useful to track dynamic routes. - You can use
routeBlacklistto exclude some routes from metrics. For example, you can exclude/api/metricsendpoint. - You can use
groupStatusCodesto group status codes. For example, you can group200and201status codes to2xxcode. - You can use
customLabelsto add custom labels to all metrics.
Conclusion
In this article, we have learned how to integrate Prometheus with Next.js. We have also seen how to use Prometheus to monitor the performance of our Next.js application. If you want to learn more about Prometheus, check out the official documentation at https://prometheus.io/docs/introduction/overview/.
This is not the best way how to monitor Next.js application, but in some cases it can be useful. Also check the official documentation for Monitoring with OpenTelemetry: https://nextjs.org/docs/app/building-your-application/optimizing/open-telemetry
Code
You can find the code for this article here